Recently we have received some questions regarding the success of web push notifications, and more specifically, how any user can monitor the success of his or her individual campaigns. This is definitely a valid question, and one we want to answer for everyone.
The great news is that Aimtell tracks the actions your subscribers take, and all this info is available for you to take a look at. Our reporting tools help you clearly see which campaigns are working and which are not (among other things). You will find that accessing this data is as simple as pulling up your dashboard.
Let’s dive in and discuss everything that is available to you.

Right off the bat you are able to get an idea of what percentage of people are opting in to your notifications. This percentage is based on how many users who viewed your opt-in prompt clicked to subscribe. Keep in mind this will not take into consideration people who view your website but are not shown a prompt (for example, users who use Safari on their iPhone). For example, if 50 people were shown your opt-in prompt and 32 decided to subscribe, your opt-in percentage would be 64%.
You can filter this data a few different ways. First, you can view this data based on a date range. Simply input the dates you wish to isolate and you’ll see results from those days only. You can also filter based on the segments you have created.
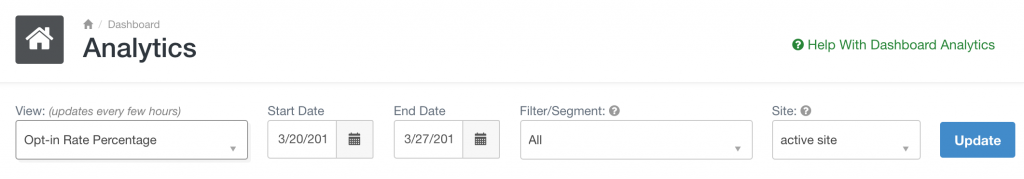
This menu bar will appear when you select ‘Analytics’ from the sidebar once you log in to your dashboard. As you can see, the bar pictured above will display your opt-in rate percentage based on users who saw your opt-in prompt between March 20th and 27th of this year. Clicking the drop down menu under ‘Filter/Segment’ will display your list of segments. You can select one if you want, or leave it on ‘All’ to get a total view of subscribers for the given time. Select ‘Update’ to view your data. The drop down menu under ‘Site’ allows you to select which website you want to see data for. You can choose to view data for all of your websites you have connected, or just the active site you are viewing.
You can also view other types of data from the same location you viewed your opt-in rate percentage. Clicking the drop down menu under ‘View’ will let you analyze different sets of info, which we will discuss below.
You are able to view your total number of new subscribers from this same location by selecting ‘New Subscribers’ from the ‘View’ dropdown box.

Don’t confuse this info with your opt-in rate percentage. For example, say you want to view how many new subscribers you got during the first week of March. After inputting this date range say you discover you received 100 new subscribers. Now say during that week of March 300 people saw your opt-in prompt. This means your new subscribers is 100 and your opt-in percentage rate is around 33%.
These two numbers are important to monitoring your campaign success, and just like with your opt-in rate, you can filter your new subscribers by date range as well as by a certain segment. You might want to see how many new subscribers you got who live in the state of New York, for example. As long as you have a segment created for users who live in this state, you will be able to view that data.
If you want more help with setting up segments, click here.
Two more pieces of data you can view from this same Analytics area is how many notifications you have sent, as well as how many notifications have been clicked. This is not specific to any certain campaign, but rather gives you a total amount of sent notifications and total amount of clicks.

You can filter how many notifications were sent based on any date range you like. Simply click ‘Notifications Sent’ from the ‘View’ drop down menu, select the dates you want to view, and click ‘Update’.

The same goes for viewing how many notifications users click. Select ‘Notifications Clicked’ from the ‘View’ bar, input your date range, and click ‘Update’.
You may combine this information together to see your click through rate for all of your campaigns for a given time. For example, say you get the information for notification clicks and sends for the month of February. If you sent a total of 1,000 notifications, and 420 were clicked, your cumulative click through rate for the month would be 42%.
We provide our users the ability to set up custom events and custom attributes to help further understand customer’s actions on their websites. If you have done so, you have the ability to see how many times either your custom event or attribute was triggered during a given date range. You can also filter this data via segments you have on your website.


Select either ‘Custom Events Triggered’ or ‘Custom Attributes Triggered’ from the ‘View’ menu, determine what date range or segment you want to analyze, and select ‘Update’.
For more help with custom events, click here. For help with custom attributes, click here.
The final set of data you can view from the Analytics page is how many people have unsubscribed from your notifications. You can view this data based on any date range you want.

Select ‘Unsubscribed’ from the ‘View’ bar, input the date range you want to view, and click ‘Update’.
Conversion rates are crucial to determining the success of a campaign. If you have a ‘Basic’ or above plan, you can view the conversion rate for any manual or triggered campaign you send.
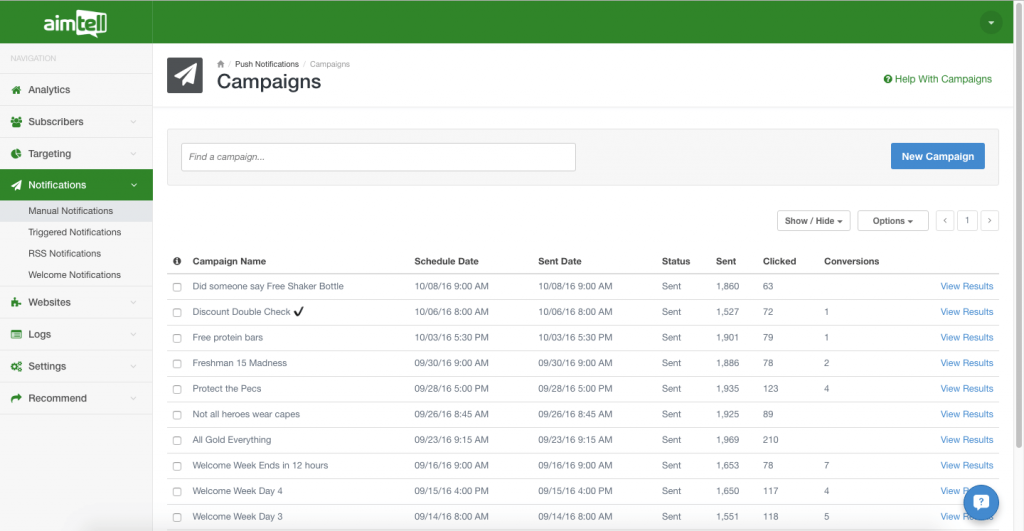
You can get a quick overview of your conversions when looking at your list of campaigns, as pictured above. If you want a more detailed view, click on ‘View Results’ in the final column for any campaign you have sent.

Clicking ‘View Results’ will give you a detailed view of the campaign you selected. At the top you will see a quick overview of the number of notifications that were sent, clicked, and how many conversions resulted from the campaign. Selecting the ‘Conversions’ tab will show you a detailed view of each conversion that took place, as you can see in the above example.
From the Analytics page you can view your total number of campaigns sent and clicked, but you also have the ability to see this data for specific campaigns. Go to your list of campaigns to see how many notifications were sent and opened for each campaign. Click ‘View Results’ for a more detailed view of this information.
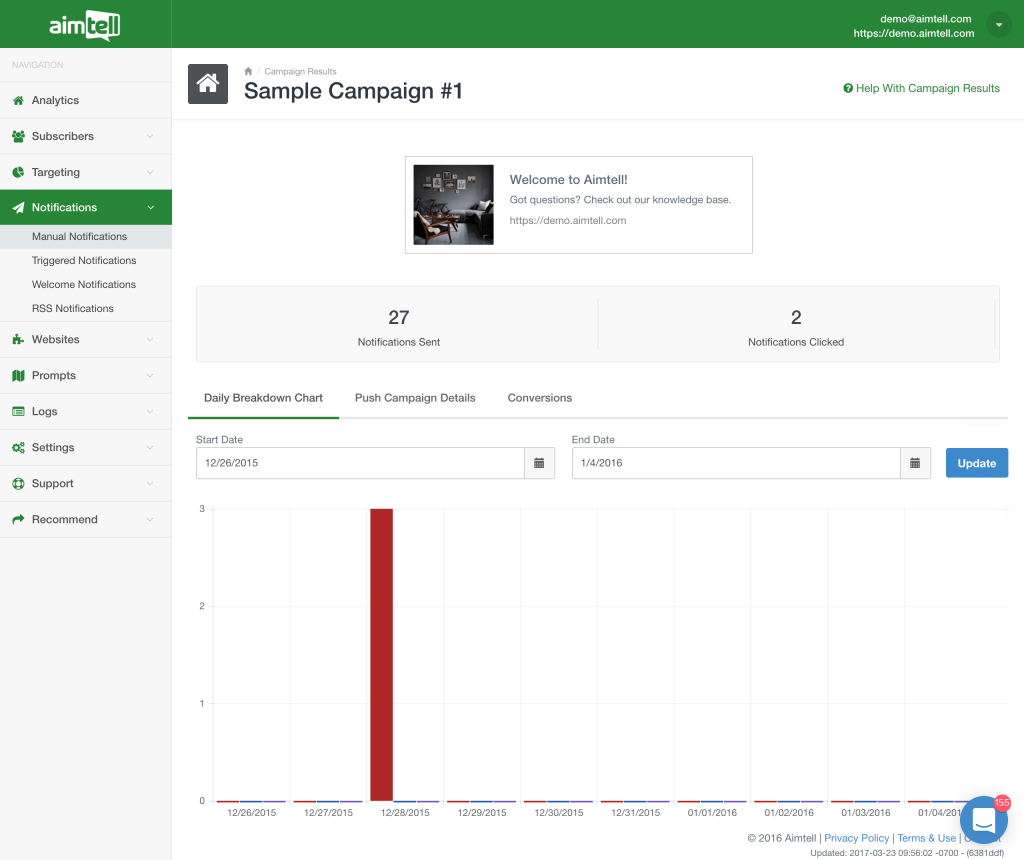
The above example shows an old demo notification we sent out. Selecting ‘View Results’ lead to this page which shows us the breakdown of notifications sent and clicked (conversions are not listed because we do not have the right type of plan). You can further filter this information by selecting a date range and selecting update.

Finally, you have the option to add UTM parameters to any campaign you create. After inputting your destination URL for any manual campaign simply check the box ‘Include UTM Params’ to update the link (as seen in the picture above). You may also manually add a UTM parameter to any other campaign you create.
Whenever anyone clicks the link, or in this case clicks the notification which directs to the link, the information records and tracks for you. This information you view within Google Analytics, something you can learn more about by clicking here.
UTM parameters help you further understand not just how well your web push notifications are performing, but also how they are performing in relation to other marketing efforts. For example, say you send out an email newsletter with the same landing page destination as the link in your web push notification. By adding a unique UTM parameter to the push notification as well as to the email newsletter, you can compare how the links are performing in various locations. You may find more people are clicking the link from the push notification than from the email, for example.
Hopefully this post helps you understand just how much information you have available to help you understand how your campaigns are working. Is there a feature you would like to see that we don’t currently have available? Please let us know by commenting below or sending us an email.
To start using Aimtell, click here.